Manufacturing IoT & Quality Platform
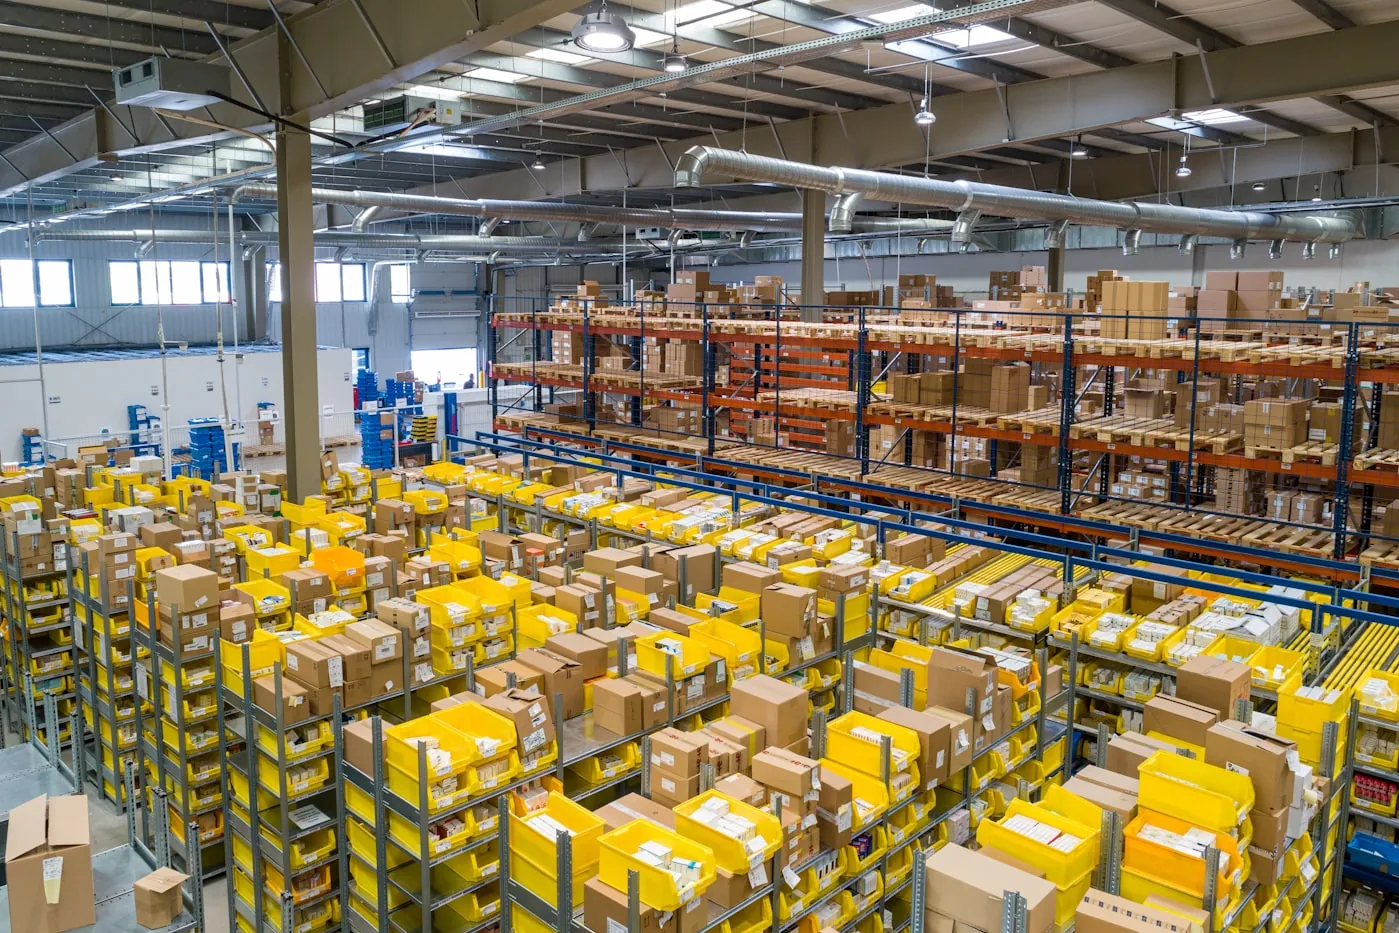
Shop-floor telemetry, OEE dashboards and computer-vision quality inspection deployed across two production lines.
- Duration
- 9 months
- Real time
- Line performance visibility per shift
- Earlier
- Defect detection in the production sequence
- Reviewed
- Low-confidence cases routed to an operator
The Challenge
Line performance was recorded manually at shift end, so problems were identified hours after they began. Surface defects were caught at final inspection, after value had already been added to faulty units.
Our Solution
We instrumented the lines with sensor telemetry into a streaming pipeline, delivered live OEE dashboards, and deployed a vision model at an earlier inspection point to flag defects as they appear.
How the work was sequenced
Technologies
- 01
Sensor and PLC data acquisition design
- 02
Streaming ingestion and time-series storage
- 03
OEE and downtime-reason dashboards
- 04
Vision model training with a labelled defect dataset
- 05
Human review console for low-confidence detections
Sample project: this case study is illustrative content created for this website build. It does not represent a real client, engagement or verified outcome.
How a build like this is put together
The reference architecture and delivery pipeline below are the shape we would apply to a project of this kind. Both are illustrative, like the rest of this sample case study.
- L1Clients
- Browser and mobile clients built from one design system and one typed API contract. (Web · Next.js, Mobile · React Native)
- L2Edge
- CDN, WAF and TLS termination. Static assets and cacheable reads never reach the origin. (CDN + WAF, TLS termination, Static cache)
- L3API gateway
- One entry point: OIDC authentication, per-tenant rate limits, request routing and audit logging. (Auth · OIDC, Rate limiting, Routing + audit)
- L4Services
- Independently deployable services communicating over HTTP and an event bus, each owning its data. (identity-svc, orders-svc, billing-svc, events-worker)
- L5Data layer
- Primary relational store with read replicas, a cache tier, object storage and an analytics warehouse. (PostgreSQL, Redis cache, Object store, Warehouse)
- 01commit
Status: passed · 0m 06s
Signed commit, conventional message, linked ticket.
- 02build
Status: passed · 2m 18s
Reproducible container image with an SBOM attached.
- 03test
Status: passed · 3m 44s
1,284 unit, contract, accessibility and security checks.
- 04stage
Status: passed · 1m 21s
Deployed to staging, smoke suite and migration dry-run.
- 05prod
Status: passed · 2m 12s
Canary at 10%, promoted on clean metrics, 24h rollback.
Sample pipeline run shown for demonstration. Stage names reflect how we structure delivery; the run, commit reference and durations are illustrative.

Have a Technology Challenge?
Let's discuss how technology can help your business grow.