Data Analytics
Business intelligence, reporting and data platforms that turn operational data into decisions.
- Practice
- Data Analytics
- Deliverables
- 8 defined outputs
- Core tools
- PostgreSQL · BigQuery · Snowflake
- Support
- Retainer available post-launch
We build the pipelines, warehouse models and dashboards that give leadership a reliable, shared view of the business — replacing conflicting spreadsheet reports with agreed definitions.
The work is deliberately unglamorous: correct data, defined metrics, and dashboards people actually open.
What usually brings clients to us
- 01Conflicting numbersDifferent teams report different figures for the same metric because definitions are undocumented.
- 02Manual reporting cyclesAnalysts spend days each month assembling reports by hand from exported files.
- 03Data trapped in systemsOperational data sits in tools that do not talk to each other.
How we address it
Single warehouse layer
All sources consolidated into a governed warehouse with tested transformations.
Metric definitions in code
Business definitions are version-controlled, reviewed and reused everywhere.
Self-service dashboards
Role-based dashboards designed around the decisions each team actually makes.
What is included
- 01Data warehouse and lakehouse design
- 02ETL / ELT pipeline engineering
- 03Data quality testing and observability
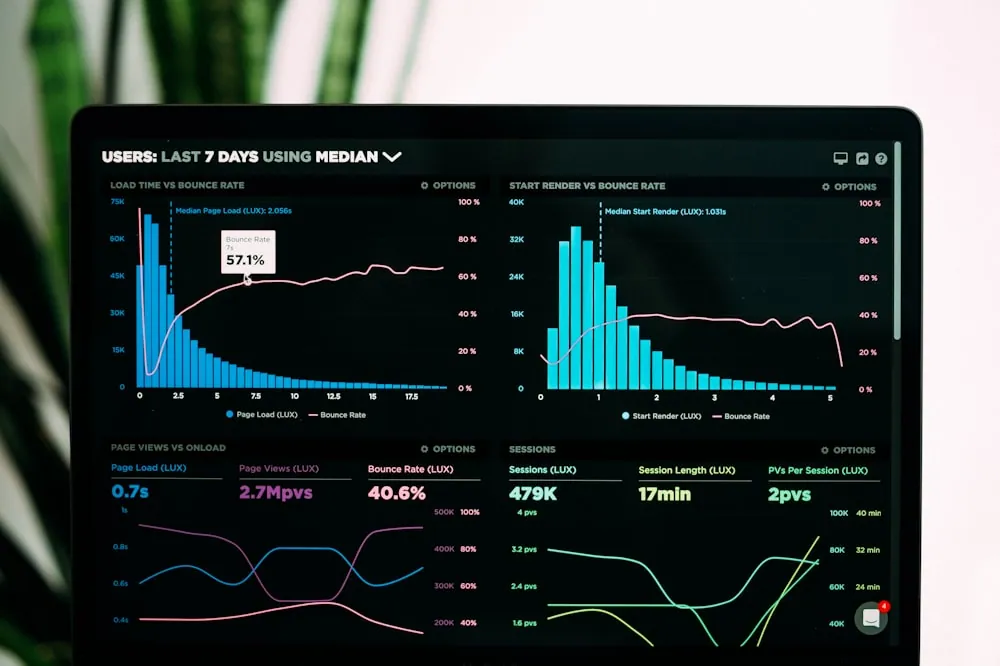
- 04Executive and operational dashboards
- 05Self-service analytics enablement
- 06Forecasting and cohort analysis
- 07Data governance and access control
- 08Migration from legacy reporting tools
What changes for you
Decisions in hours, not weeks
Leadership gets current numbers without waiting on a reporting cycle.
One agreed definition
Metrics mean the same thing in every meeting and every dashboard.
Analyst time recovered
Automation replaces manual assembly so analysts can do actual analysis.
Technology
-- Incremental fact table. Tested on every run: not_null, unique, relationships.with source as ( select * from staging.orders where updated_at > (select coalesce(max(updated_at), '1900-01-01') from fct_orders))select o.order_id, o.store_id, o.placed_at, o.fulfilled_at, o.fulfilled_at - o.placed_at as fulfilment_interval, o.gross_amount - o.discount_amount as net_amountfrom source owhere o.is_test = false;- Handover
- Source, infrastructure, runbooks and decision records
- Reviews
- Every change goes through a peer-reviewed pull request
- Gates
- lint · types · unit · contract · a11y · dependency audit
- Ownership
- Code and infrastructure transfer to you on completion
How the engagement runs
Scroll sideways for all seven stages →
Data Analytics — common questions
Yes. We build the underlying data model and connect it to whichever BI tool your team already uses.
A first useful dashboard on a priority domain is typically achievable within the first few weeks, with the wider platform built out behind it.
Yes. Access control, masking of sensitive fields and retention policies are part of the platform design.
Ready to talk about data analytics?
Let's discuss how technology can help your business grow.