Financial Services Analytics Platform
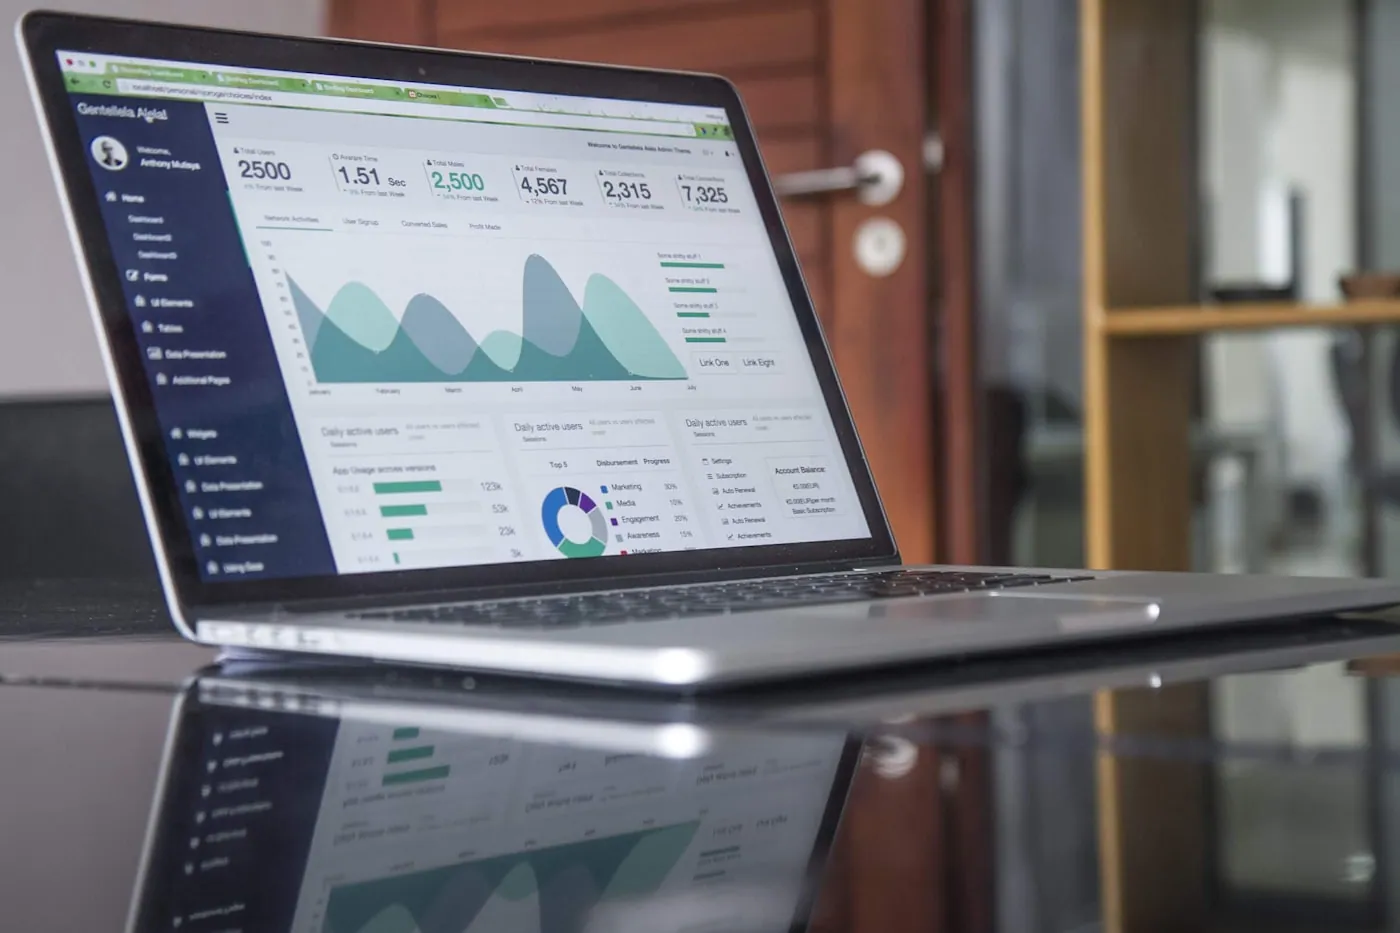
A governed data warehouse and executive dashboard suite consolidating lending, collections and customer data for a financial services firm.
- Duration
- 6 months
- One
- Agreed definition per business metric
- Daily
- Automated refresh replacing monthly assembly
- Governed
- Role-based access across departments
The Challenge
Each department produced its own monthly figures from exported files. Definitions of core metrics differed between teams, and leadership meetings routinely started with a dispute about whose numbers were correct.
Our Solution
We consolidated every source into a governed warehouse, encoded metric definitions in version-controlled transformations, and delivered role-based dashboards with automated daily refresh.
How the work was sequenced
Technologies
- 01
Source system inventory and data profiling
- 02
Warehouse modelling with tested transformations
- 03
Metric definition catalogue agreed with each department
- 04
Executive, operations and risk dashboards
- 05
Data quality alerting and access governance
Sample project: this case study is illustrative content created for this website build. It does not represent a real client, engagement or verified outcome.
How a build like this is put together
The reference architecture and delivery pipeline below are the shape we would apply to a project of this kind. Both are illustrative, like the rest of this sample case study.
- L1Clients
- Browser and mobile clients built from one design system and one typed API contract. (Web · Next.js, Mobile · React Native)
- L2Edge
- CDN, WAF and TLS termination. Static assets and cacheable reads never reach the origin. (CDN + WAF, TLS termination, Static cache)
- L3API gateway
- One entry point: OIDC authentication, per-tenant rate limits, request routing and audit logging. (Auth · OIDC, Rate limiting, Routing + audit)
- L4Services
- Independently deployable services communicating over HTTP and an event bus, each owning its data. (identity-svc, orders-svc, billing-svc, events-worker)
- L5Data layer
- Primary relational store with read replicas, a cache tier, object storage and an analytics warehouse. (PostgreSQL, Redis cache, Object store, Warehouse)
- 01commit
Status: passed · 0m 06s
Signed commit, conventional message, linked ticket.
- 02build
Status: passed · 2m 18s
Reproducible container image with an SBOM attached.
- 03test
Status: passed · 3m 44s
1,284 unit, contract, accessibility and security checks.
- 04stage
Status: passed · 1m 21s
Deployed to staging, smoke suite and migration dry-run.
- 05prod
Status: passed · 2m 12s
Canary at 10%, promoted on clean metrics, 24h rollback.
Sample pipeline run shown for demonstration. Stage names reflect how we structure delivery; the run, commit reference and durations are illustrative.



Have a Technology Challenge?
Let's discuss how technology can help your business grow.